Comparison of character frequency in the covers of X-Men Issues 200-249
Hello and welcome to my midterm. I’ve chosen to analyze the different frequencies of the characters across the cover of the Uncanny series of X-Men comics, specifically the sample of those between Issue 200 and Issue 249 (Adding more issues would certainly skew results).
The dataset used was from The Claremont Run, a collaborative dataset focused on analyzing and appreciating Chris Claremont’s Uncanny X-Men series. The data was fairly crude and had a lot of extra material I wasn’t interested in. Lists of characters on the covers were also not laid out in an easy to analyze way (and some of the names had inconsistencies or typos) but that was all cleaned up in OpenRefine and Apple’s eXcel equivalent. Then I imputed the values into Flourish.
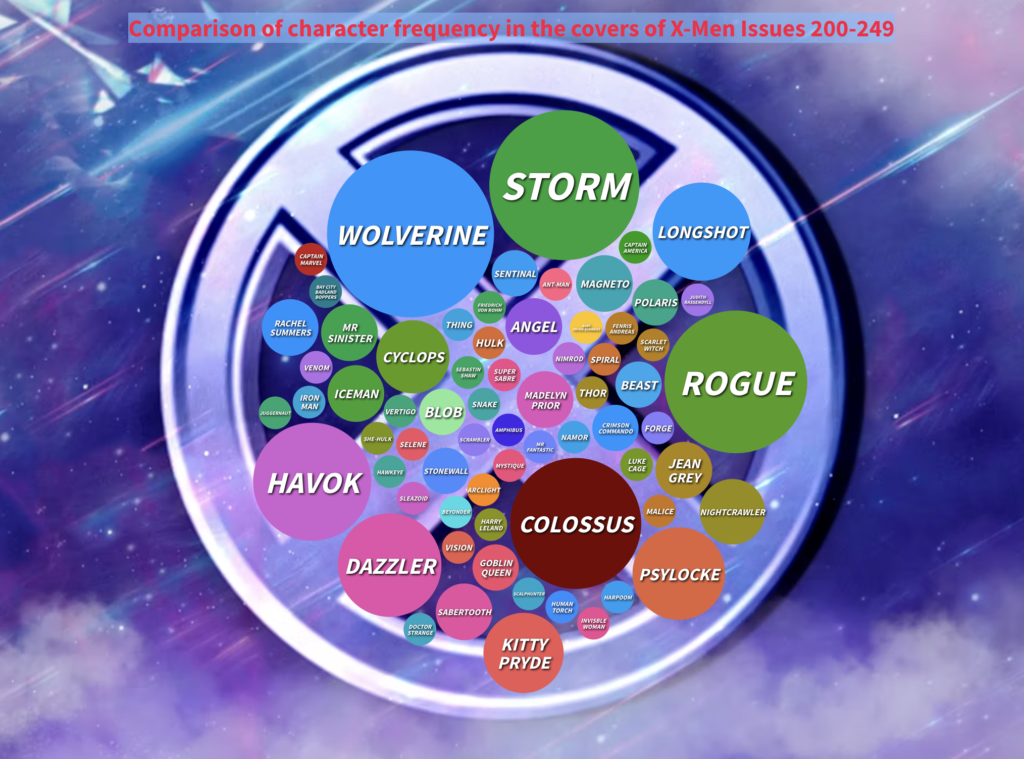
In the image, every named character featured on one of the covers of the issues is represented as a bubble and the size of those bubbles related to their frequency in appearance. Bubble charts can be controversial due to mis-use but this felt like an example where it was necessary and showed information informatively.
Comic covers are the main way of marketing a comic in-store. If a character is very popular, the comic’s team would want to put them on the cover to draw attention. Cyclops is a good example of someone who had enough frequent appearance in comics to appear on the covers multiple times but wasn’t marketed as much (especially compared to Wolverine, the biggest bubble). Obviously comic books aren’t the most important thing to analyze but understanding a superhero team’s varied popularity through cover marketing shines a perspective onto the comic book industry not many consider.
